Hi,
Can any one give me some advise why I can’t get a V17 site to boot, I have set all File and Folder Permissions per this File and Folder Permissions | CMS | Umbraco Documentation .
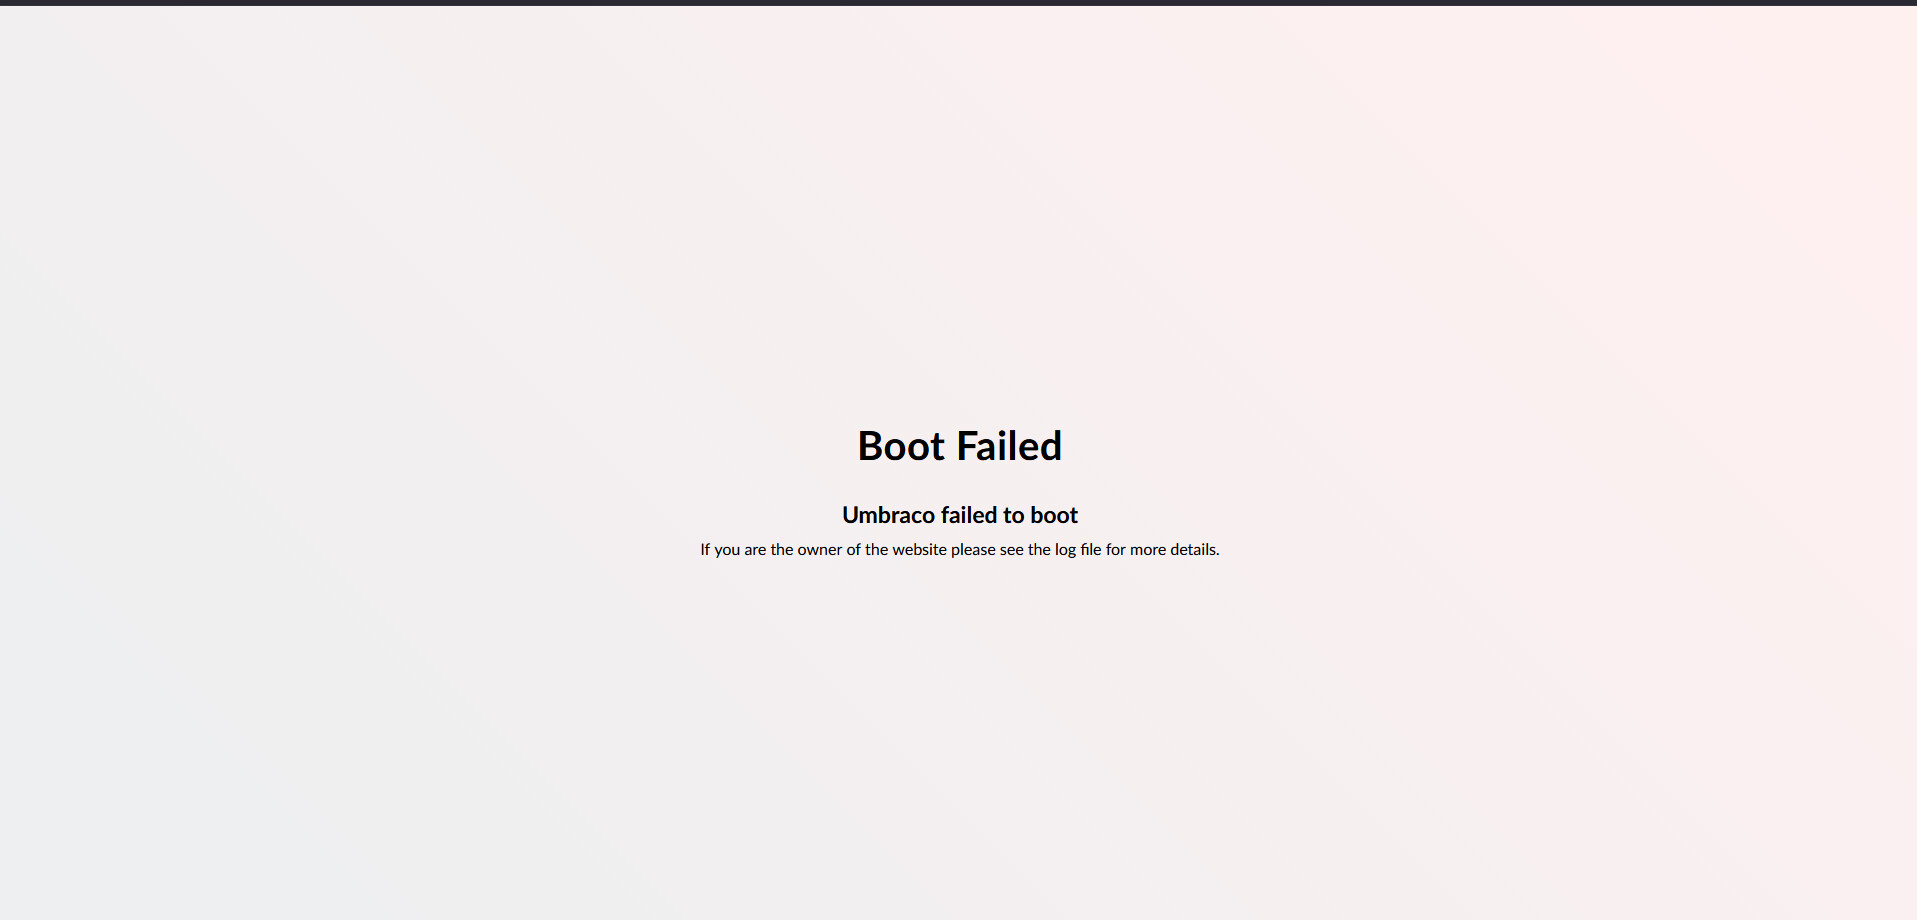
But when I start the app pool and then the site, all I get is a message saying boot fail.
I made sure the Connection String is correct and it is, but there nothing showing in any of the logs.
Can some one point me in the correct direction!!
Thanks
Darren
Hi @darrenhunterEmerald ,
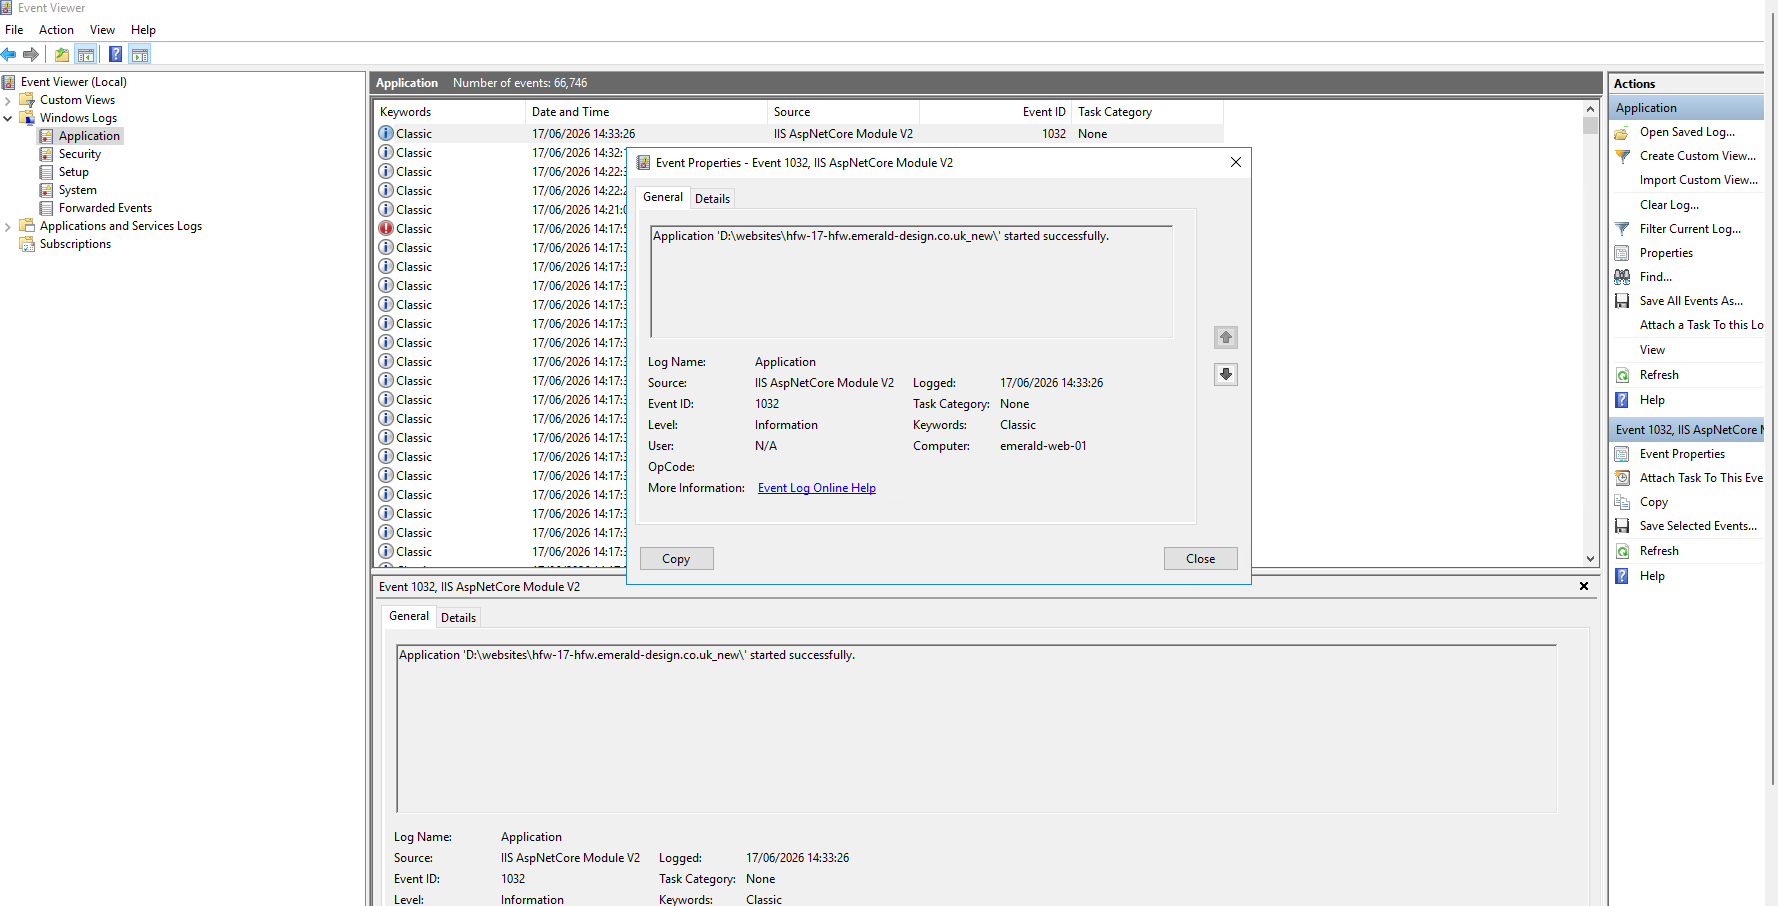
Would you please try checking the event logs once:
Press Win + R, type eventvwr, and hit Enter.
Go to Windows Logs > Application.
Look for Error entries from IIS AspNetCore Module or .NET Runtime.
Hi,
There nothing showing in the IIS logs, Umbraco Logs Or App Log.
I see this is the app log
The last line of the Umbraco log is
{“@t”:“2026-06-17T13:33:26.3645183Z”,“@mt”:“Completed starting recurring background jobs hosted services”,“SourceContext”:“Umbraco.Cms.Infrastructure.BackgroundJobs.RecurringBackgroundJobHostedServiceRunner”,“ProcessId”:14316,“ProcessName”:“w3wp”,“ThreadId”:2,“ApplicationId”:“ecefeb8f1fba6b30db6c009831b0653a8956f893”,“MachineName”:“EMERALD-WEB-01”,“Log4NetLevel”:“INFO “}
{”@t”:“2026-06-17T13:36:26.3805566Z”,“@mt”:“Umbraco Forms scheduled record deletion task will not run as it has not been enabled via configuration. To enable, set the configuration value at ‘Umbraco:Forms:Options:ScheduledRecordDeletion:Enabled’ to true.”,“SourceContext”:“Umbraco.Forms.Core.HostedServices.ScheduledRecordDeletion”,“ProcessId”:14316,“ProcessName”:“w3wp”,“ThreadId”:14,“ApplicationId”:“ecefeb8f1fba6b30db6c009831b0653a8956f893”,“MachineName”:“EMERALD-WEB-01”,“Log4NetLevel”:"INFO "}
and the IIS log is this
Fields: date time s-ip cs-method cs-uri-stem cs-uri-query s-port cs-username c-ip cs(User-Agent) cs(Referer) sc-status sc-substatus sc-win32-status time-taken
2026-06-17 13:04:53 192.168.111.100 GET / - 443 - 87.102.25.241 Mozilla/5.0+(Windows+NT+10.0;+Win64;+x64;+rv:152.0)+Gecko/20100101+Firefox/152.0 - 500 0 0 10333
2026-06-17 13:04:53 192.168.111.100 GET /umbraco/website/nonodes.css - 443 - 87.102.25.241 Mozilla/5.0+(Windows+NT+10.0;+Win64;+x64;+rv:152.0)+Gecko/20100101+Firefox/152.0 https://hfw-17-hfw.emerald-design.co.uk/ 200 0 0 49
2026-06-17 13:04:53 192.168.111.100 GET /favicon.ico - 443 - 87.102.25.241 Mozilla/5.0+(Windows+NT+10.0;+Win64;+x64;+rv:152.0)+Gecko/20100101+Firefox/152.0 https://hfw-17-hfw.emerald-design.co.uk/ 200 0 0 41
2026-06-17 13:04:53 192.168.111.100 GET /umbraco/website/fonts/lato/LatoLatin-Bold.woff2 - 443 - 87.102.25.241 Mozilla/5.0+(Windows+NT+10.0;+Win64;+x64;+rv:152.0)+Gecko/20100101+Firefox/152.0 https://hfw-17-hfw.emerald-design.co.uk/umbraco/website/nonodes.css 200 0 0 54
2026-06-17 13:04:53 192.168.111.100 GET /umbraco/website/fonts/lato/LatoLatin-Regular.woff2 - 443 - 87.102.25.241 Mozilla/5.0+(Windows+NT+10.0;+Win64;+x64;+rv:152.0)+Gecko/20100101+Firefox/152.0 https://hfw-17-hfw.emerald-design.co.uk/umbraco/website/nonodes.css 200 0 0 106
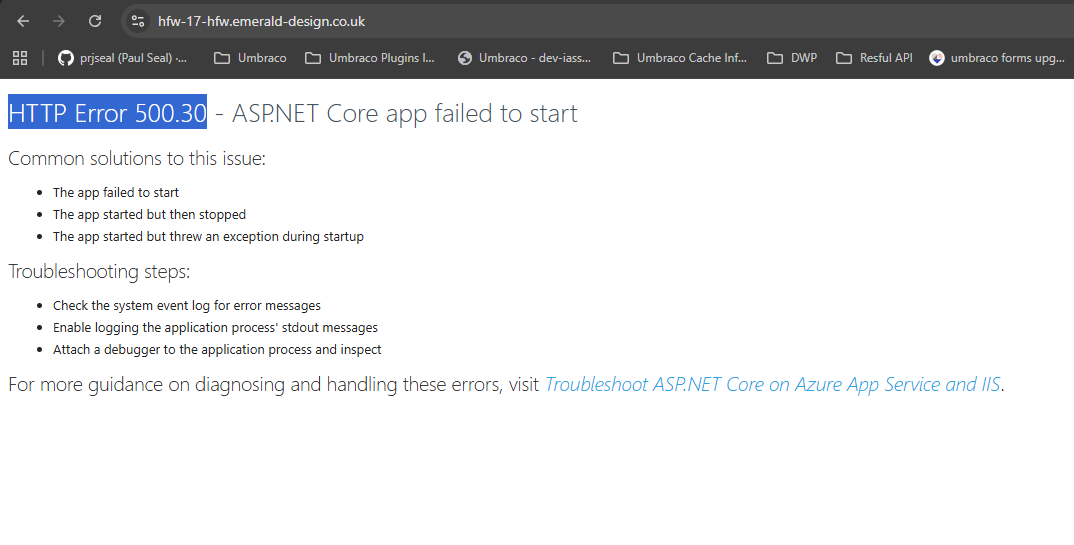
In the browser I see this
Any Suggestions.
Thanks
Darren
Hi @darrenhunterEmerald
What do you see in the logs if you change stdoutLogEnabled to true in the web.config?
  <aspNetCore processPath="dotnet" arguments=".\xxx.Web.dll" stdoutLogEnabled="true" stdoutLogFile=".\logs\stdout" hostingModel="inprocess">
    <environmentVariables>
      <environmentVariable name="ASPNETCORE_ENVIRONMENT" value="Production" />
    </environmentVariables>
  </aspNetCore>
Justin
I have updated the web config and still nothing in the logs.
All I can say about the site is that it been upgraded form V10 > 13 and to 17, works in Visual Studio but not in IIS.
All Packages are updated to the latest version as well as Umbraco.
Hi @darrenhunterEmerald
Have you installed the .NET 10 IIS Hosting Bundle?
Justin
@darrenhunterEmerald Could you please try forcing IIS to Dev mode if it’s set to Production:
<aspNetCore processPath=".\YourProjectName.exe" arguments="" stdoutLogEnabled="true" stdoutLogFile=".\logs\stdout" hostingModel="inprocess">
  <environmentVariables>
    <environmentVariable name="ASPNETCORE_ENVIRONMENT" value="Development" />
  </environmentVariables>
</aspNetCore>
Hi,
Yes we have another 17 site on the server that running correctly, or at least the back office is as there no frontend on the site, as we are waiting for the client to sign off on the visuals.
It just generates a white page on the public side, and the back office is working as expected.
Regards
Darren
I have set the web config to
<?xml version="1.0" encoding="utf-8"?>
  <!--<aspNetCore processPath="dotnet" arguments=".\UmbracoCMS.dll" stdoutLogEnabled="false" stdoutLogFile=".\logs\stdout" hostingModel="inprocess" />-->
  <aspNetCore processPath=".\UmbracoCMS.exe" arguments="" stdoutLogEnabled="true" stdoutLogFile=".\logs\stdout" hostingModel="inprocess">
  <security>
    <requestFiltering removeServerHeader="true">
      <requestLimits maxAllowedContentLength="52428800" maxQueryString="8192" />
    </requestFiltering>
  </security>
</system.webServer>
Site boots
But I not sure if this is a suitable fix!
Hi @darrenhunterEmerald
Are you running in production runtime mode? It may be worth double checking the logs as you will get this if the runtime validation fails. Running in development as @ShekharTarare suggests will proove or disproove this…
Justin
How do I check what mode is IIS is running this site in???
The reason I asked to change the mode is to see what errors it throws. As the Production mode hides those. As @justin-nevitech mentioned Please check for logs to see the errors.
You can check the mode using environment variable which will be on web.config file:
<environmentVariables>
  <environmentVariable name="ASPNETCORE_ENVIRONMENT" value="Development" />
</environmentVariables>
I saw the XML you posted earlier and it was missing the env variable, As there is no <environmentVariables> node inside your <aspNetCore> tag, IIS is automatically defaulting your site to Production mode. This is why your errors are hidden and why you got that generic white “Boot Failed” screen instead of a detailed developer stack trace. If you ever need to temporarily force IIS into Development mode to read a startup error, you have to manually add that environment variable node into this generated file on the server.
Regards,
Shekhar
Hi @darrenhunterEmerald
Runtime mode is an Umbraco thing, see the docs here:
Although, if you’ve not set it then it should run without any prerequisites or conditions…
Justin
I have updated the app settings to set it to production and I am getting:
But what I dont get is we have another V17 site on the same server and that working with out any problems.
That was a clean build.
This one was Upgraded from V10 to 13 and then to 17.
Could the upgrade process be behind the issue I am getting when I try and start the site!
Darren
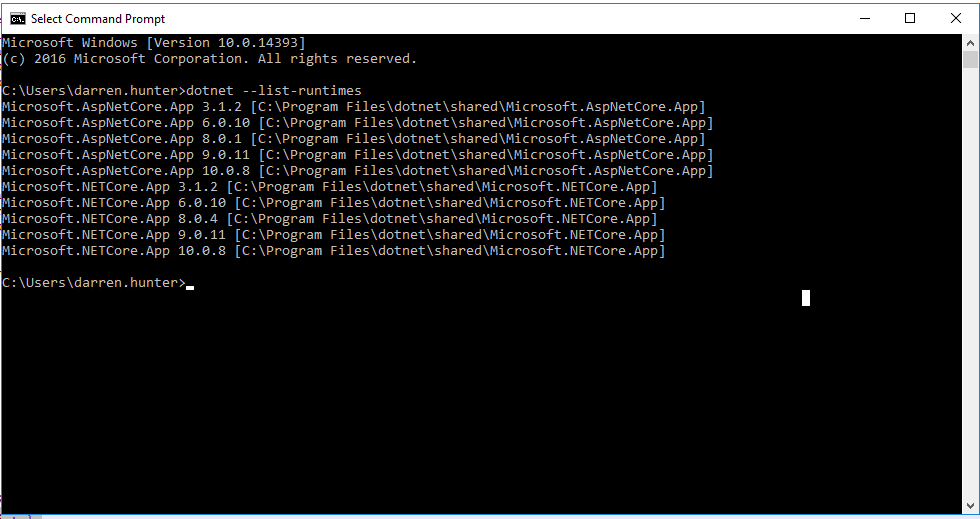
I have also checked the versions of .Net core installed on the server and we get this
This Confirm V10 is installed so I am not missing that!
Hi @darrenhunterEmerald
There must be something in either the .NET output log, the server Event Log, or the Umbraco log telling you why it has failed to boot. Have you got as much logging as possible turned on and have you checked across all of these logs?
If you’ve got other V17 sites on that server it cannot be .NET in that case…
Justin
I added the following on my Local IIS:
{“@t”:“2026-06-18T15:06:37.5766959Z”,“@mt”:“An unhandled exception has occurred while executing the request.”,“@l”:“Error”,“@x”:“Umbraco.Cms.Core.Exceptions.BootFailedException: Boot failed: Umbraco cannot run. See Umbraco’s log file for more details.\r\n at Umbraco.Cms.Core.Exceptions.BootFailedException.Rethrow(BootFailedException bootFailedException)\r\n at Umbraco.Cms.Web.Common.Middleware.BootFailedMiddleware.InvokeAsync(HttpContext context, RequestDelegate next)\r\n at Microsoft.AspNetCore.Builder.UseMiddlewareExtensions.InterfaceMiddlewareBinder.<>c__DisplayClass2_0.<b__0>d.MoveNext()\r\n— End of stack trace from previous location —\r\n at SeoToolkit.Umbraco.Redirects.Core.Middleware.RedirectMiddleware.Invoke(HttpContext context)\r\n at SeoToolkit.Umbraco.RobotsTxt.Core.Middleware.RobotsTxtMiddleware.Invoke(HttpContext context, IEventAggregator notificationPublisher)\r\n at SeoToolkit.Umbraco.Sitemap.Core.Middleware.SitemapMiddleware.Invoke(HttpContext context, ISitemapGenerator sitemapGenerator, ISitemapIndexGenerator sitemapIndexGenerator)\r\n at SixLabors.ImageSharp.Web.Middleware.ImageSharpMiddleware.Invoke(HttpContext httpContext, Boolean retry)\r\n at Umbraco.Forms.Web.HttpModules.ProtectFormUploadRequestsMiddleware.InvokeAsync(HttpContext context, RequestDelegate next)\r\n at Microsoft.AspNetCore.Builder.UseMiddlewareExtensions.InterfaceMiddlewareBinder.<>c__DisplayClass2_0.<b__0>d.MoveNext()\r\n— End of stack trace from previous location —\r\n at Umbraco.Cms.Api.Management.Middleware.BackOfficeAuthorizationInitializationMiddleware.InvokeAsync(HttpContext context, RequestDelegate next)\r\n at Microsoft.AspNetCore.Builder.UseMiddlewareExtensions.InterfaceMiddlewareBinder.<>c__DisplayClass2_0.<b__0>d.MoveNext()\r\n— End of stack trace from previous location —\r\n at Microsoft.AspNetCore.Diagnostics.DeveloperExceptionPageMiddlewareImpl.Invoke(HttpContext context)”,“@tr”:“35fcc0ed6c58b4a843b9dda0c6405812”,“@sp”:“adc8b9c93b6bfbb9”,“EventId”:{“Id”:1,“Name”:“UnhandledException”},“SourceContext”:“Microsoft.AspNetCore.Diagnostics.DeveloperExceptionPageMiddleware”,“RequestId”:“40000012-0001-f100-b63f-84710c7967bb”,“RequestPath”:“/”,“ProcessId”:38148,“ProcessName”:“w3wp”,“ThreadId”:10,“ApplicationId”:“c1c16628c6b5681ac41ac31b81b7ea5961e75d53”,“MachineName”:“DESKTOP-V4NETMQ”,“Log4NetLevel”:“ERROR”}
It looking like SEO tools as an issue.
@darrenhunterEmerald ,
What you are looking at is an ASP.NET Core Middleware Pipeline trace. When a web request hits your server, it passes through a sequence of checkpoints.
- The request successfully passed through
SeoToolkit.Umbraco.Redirects.
- It passed through
SeoToolkit.Umbraco.RobotsTxt and SeoToolkit.Umbraco.Sitemap.
- It passed through
ImageSharp and Umbraco.Forms.
- Finally, it hit
Umbraco.Cms.Web.Common.Middleware.BootFailedMiddleware, which immediately threw the exception.
When Umbraco fails to start up behind the scenes, it injects a “STOP” sign into this pipeline. Any time a browser tries to load a page, the BootFailedMiddleware intercepts it and throws an exception to prevent the site from serving broken content. The plugins listed in your stack trace were just the normal checkpoints the request safely passed through before hitting that wall.
You need to look at the exact same JSON log file, but scroll further up to the very beginning of the boot sequence. Look for log entries with timestamps from the exact moment the IIS App Pool was started or recycled.
Regards,
Shekhar
1 Like
Hi @darrenhunterEmerald
As @ShekharTarare says, there should be another entry that is the actual cause. You are just seeing the failure which happens during the middleware pipeline so the stack trace will show the other middleware that has already run - it is not necessarily the source of the problem.
If you delete all of the Umbraco log files and run from a clean start, the log should show only what happened when starting up that time and should contain the error. It may also be worth setting the serilog levels to debug in your appsettings.xxx.json to capture as much output as possible.
Justin
Thank you all for your help.
By Adding Web Routing to the App Json file I was able to get the site to boot.
The instance of Umbraco has 3 sites under one instance.
Odd, But hay ho it working now.
Regards
Darren
2 Likes