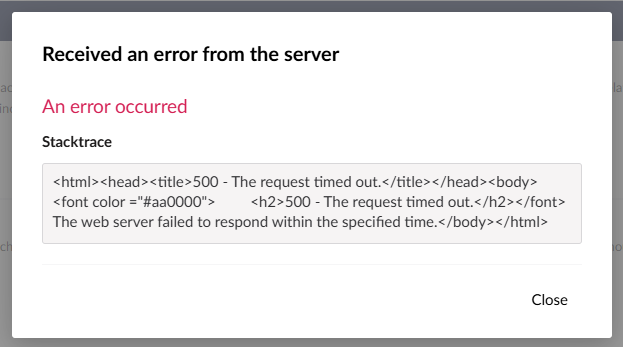
I think it’s more like a request timeout instead of an SQL timeout. It depends on your hosting platform how to increase the timeout. What is the hosting platform?
I would image that the process is still running in the background but the request from clicking the button in the back office has timed out. The backoffice code then shows the error, but I would try monitoring DB activity to see if this is still running or not.
It wasn’t working on 50 DTUs, the database was maxing out at 100%
I’ve tried doubling it to 100 DTUs and I’ve increased the App Service plan to P2 v3 as well.
Does the database have any recommendations? I once has a recommendation to add a certain index and that brought the DTU usage down from 80% to about 4%.
Yeah, but I don’t think it will be an issue in most cases. I built a package for cookie and consent management and I used the Umbraco ContentService to register what consent the user had given. We also build the CSP header on a per user/request base, based on the consent the user had given. For instance, if the user didn’t consent to youtube, the youtube urls would not even be in the CSP header, effectively blocking everything from youtube.
However, the ConsentService turned out to be just a simple service that works directly on the database. So for every request we would get the consent for the current user, which causes massive amounts of database queries. Added an SQL index made this really fast and use very little resources (at the expense of some diskspace for the index).
I have incremented the app service plan and database DTUs.
With the database, I got the rebuild to work on 100 DTUs. Anything lower was maxing out and failing.
With the App Service Plan, I went up to P3v3, because when it was on lower than that it was giving Out of Memory exceptions when attempting the Rebuild of the Database Cache.
It currently takes 15 minutes to Rebuild of the Database Cache, the UI still times out, but I can confirm it is done by checking the database with this query:
SELECT TOP (1000) [key]
      ,[value]
      ,[updated]
  FROM [dbo].[umbracoKeyValue]
  WHERE [key] = 'Umbraco.Web.PublishedCache.NuCache.Serializer'
That query gives me the date and time of when the last successful NuCache rebuild happened.
The Rebuild of the memory cache now works once the NuCache rebuild has finished.
I will try lowering the app service down to P2v3 next to see if it still works or it has the out of memory issues again.
On a rebuild of the database cache Umbraco needs to read and re-write every single property value of every single published node from a highly normalised database. This is a hugely intensive operation for the database.
Because under normal operation Umbraco doesn’t need to read/write to the database in bulk we tend to get away with running Umbraco on underpowered database instances and slowly add more and more nodes that the database can support most of the time, but not all of the time. What you now know is that this site needs a 100DTU database to support certain operations on that much content. Running an upgrade will likely require the same.
One way round this, if you want to avoid running at 100 DTUs all the time is scaling (manually or automatically) the database instance before carrying out these kinds of operations (cache rebuild, upgrades, anything else similar).
Thinking out loud…
It would be nice if an Umbraco instance knew at which point it was going to struggle under the weight of its own content. I wonder if there’s a metric that could be used to estimate this.