Memory leak, high DTU usage Commerce

Hi community!
We are hosting a production Umbraco version 16.3.4 with Commerce in Azure, and we’re observing strange behavior.
Our client makes heavy use of the back office, and we can clearly see this issue occurring during working hours, but not, for example, over the weekend.

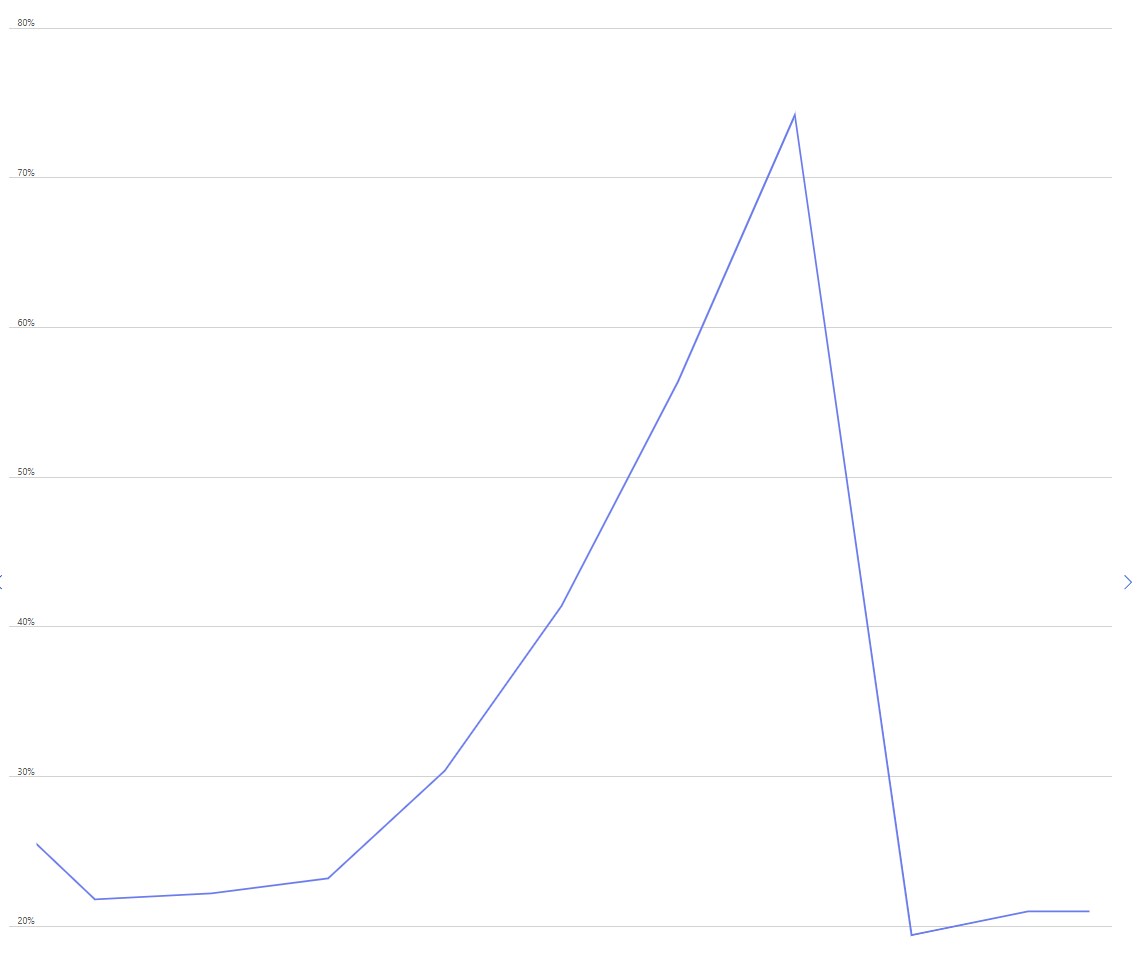
It appears that something in Commerce is causing memory usage to increase linearly without stopping until we manually restart the App Service.
We can almost perfectly map the spikes in the App Service metrics to the DTU usage on the separately hosted Azure database (which is only used by Commerce).

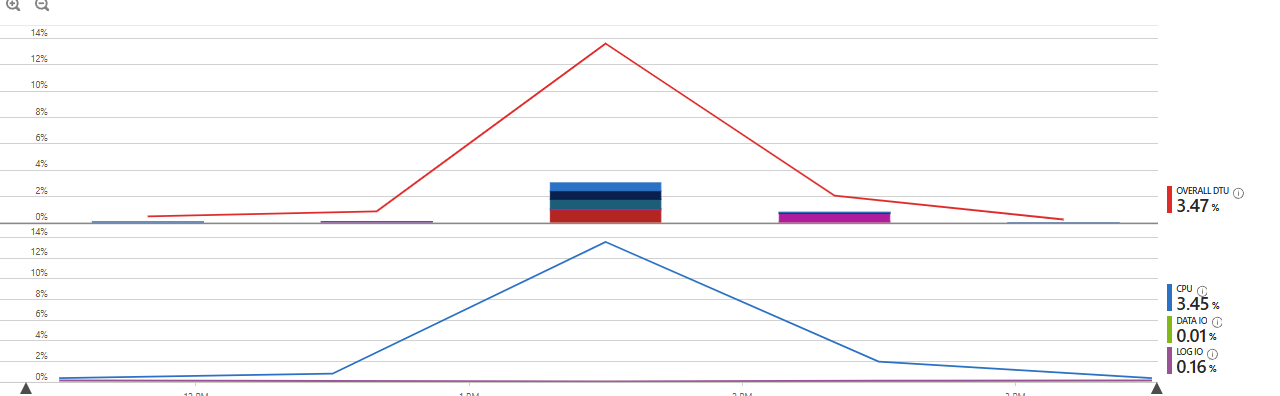
When checking these DTU spikes in Query Performance Insight, we can see which queries are heavy on the database and executed frequently.

What we notice is that the umbracoCommerceFrozenPrices table is being queried excessively — around 558,709 times over the span of one hour.
This is strange, because during the weekend it’s queried only about 500 times, maybe even less.

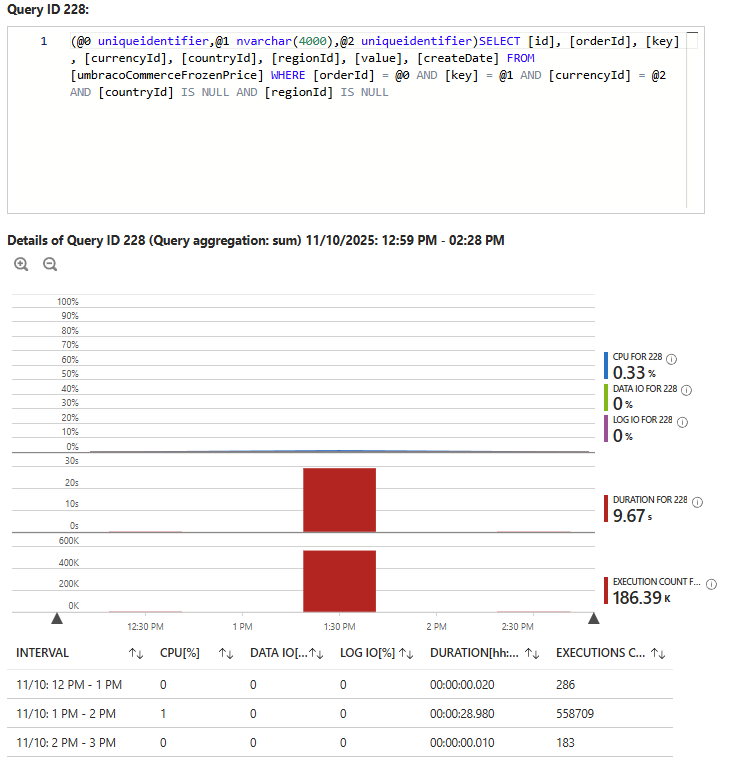
Additionally, the umbracoCommerceFrozenPrices table contains around 6100 records, which in terms of performance should definitely not be the problem.

Total

So my question is: what could be causing this behavior, since it clearly seems related?
It’s important to note that we never query this table directly.
I added some pictures to make it even more clear.

Greeting,
Joppe

Hi community!

I’m currently in contact with Umbraco Support, but so far I haven’t received a solution. If any of you happen to know the answer, I’d love to hear it!

Greetings,
Joppe!

So a couple of things I might suggest

  1. Disable serilog. We found this to be a bit of a performance bottlneck when we did perf testing
  2. Might be worth upgrading to the latest 16.4.1 which includes some new FK indexes that might improve query performance

The frozen prices table constantly being queried does seem odd as those prices should really be cached in memory too so something doesn’t seem quite right there.

I guess the question is though, is that the cause? or the symptom? It can be pretty hard to get to the bottom of what is causing slow SQL performance as those queries might be running slow but because of something else so you really need to try and fine the culprit.

Fastest way to get to the bottom of this is to “see” it happening. If you can work out what action the editors are taking in the backoffice that correspond with those spikes, then do that locally with a profiler attached and see what’s causing it.

Alternatively do you have Application Insights installed/enabled? You may be able to find better telemetry to help debug the cause of all those SQL queries.

A few more questions might shed a bit more light…

Can you get any more granularity on the SQL queries - how are they distributed across the hour?

Do you have any custom code running on notifications that could be getting stuck in a loop, encountering race conditions, or just performing some action 500K+ times?

Can you share the time scale on the memory graph? I’m trying to understand the relationship between the two. Does it match the database one exactly - i.e. it ramps up within that same hour that you see all the hits to umbracoCommerceFrozenPrices? Is the memory drop off and reduction in calls to umbracoCommerceFrozenPrices only because you restarted the instance?

Hi Matt and Jason,

We recently upgraded to Commerce 16.4.1, and since that release we haven’t encountered the issues I described above. I’ll update this thread if the issue appears again.

To answer some of your questions:

Disable Serilog
We can imagine that this might cause some performance bottlenecks. However, it’s not desirable or feasible for us to disable this logging. Insight into logging is key for us.

Custom logic
In the back-office, we allow users to trigger custom dashboards that display various data, including Commerce. We suspect the issue may indeed originate there. It’s important to mention that in our custom logic we’ve implemented extensive logging/tracking as well as cancellation tokens. At every stage of the custom logic, we can confirm that it’s not getting stuck in a loop or anything similar.
The only exception is the ICommerceApi.GetOrderAsync() function, which does not accept a cancellation token. This is the only part of the flow we cannot fully rule out as a possible cause.

Application Insights
Yes, Application Insights is enabled. However, we see a lot of traffic on an HttpContext basis, while we suspect the issue is triggered by a single transaction from an internal line of code. Despite extensive investigation in Application Insights, we haven’t yet found anything useful regarding this issue.

Is it the cause or the symptom?
We personally believe this is more of a symptom of an underlying problem rather than the actual cause. However, we can identify a correlation: in places where data is retrieved (based on the SQL queries hitting the umbracoCommerceFrozenPrices table), data is also being stored, which happens in memory and can easily grow.

Attaching profiler
We have taken several dotnet-dumps during moments when the issue occurred and analyzed them afterward. In these dumps we can clearly see the heap filling up, but we haven’t yet been able to trace it directly back to a specific piece of source code.

Notification handler loops
This is an easy one: no. We certainly use notification handlers, but not on save/mutation points, so a loop can be ruled out.

Match in graphs
The graphs can be a bit confusing at times, but in the transaction log we can, as mentioned earlier, see a direct correlation with the graphs.

Drop in memory usage
It’s correct that memory usage suddenly drops when we restart the application. We also see that the queries to the frozen prices table stop at that moment.

Hope this helps!

Greetings,
Joppe

1 Like