I’m in the process of an upgrade from 13 to 17 and hitting a memory leak when the site boots. The site auto loads into the browser showing the front end, and the RAM usage just climbs until it sucks the life out of my machine. You don’t need to interact with the browser, or go into the CMS.
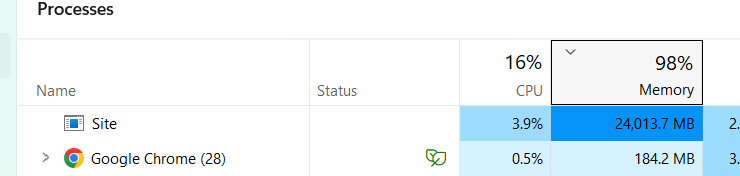
Look how small and insignificant Chrome looks in comparison, that never happens!
The story so far…
I’ve tested with an empty view to try and eliminate anything in the layout files, the site has about 50 nodes and a lot of custom data tables. No effect, still spiking
If I do a memory dump and inspect what’s taking up the space I can see there’s an inordinate amount of entries for Dictionary+Entry<String, Microsoft.AspNetCore.StaticWebAssets.ManifestStaticWebAssetFileProvider+StaticWebAssetNode>[] entries which I understand is to do with the way .NET handles/stores views and other static files. There’s also a lot of Microsoft.AspNetCore.Mvc.ApiExplorer.ApiParameterDescription entries - perhaps something with automatic api endpoint detection for Swagger?
Just to check this wasn’t a direct Umbraco “thing”, I tested against an empty v17 site pointed at the database, nothing shows as there’s no views but the memory doesn’t spike - so it’s definitely something in my code layer on top of Umbraco.
Next point of interest is that it doesn’t happen if I run it with the command line using dotnet run, so presumably this is an issue only when in development mode.
This is quite an involved site and I’ve checked all the obvious places (to me and Uncle Claude, anyway) but I’m having trouble finding the culprit. Has anyone comes across anything similar that can throw some pointers my way in where to look next please?
StaticWebAssetNode and ApiParameterDescription together look like API explorer / Swagger scanning plus static web asset manifest building, not your views - which lines up with your empty view test doing nothing.
What jumps out at me most is it only happening in dev and not under dotnet run. First thing I’d check is whether dotnet run is actually running as Development or just falling back to Production. If it’s Production then whatever’s leaking lives in your env.IsDevelopment() branch, and that narrows it right down.
Few things I’d look at:
Hot Reload / running under the debugger can balloon memory exactly like this, and it’d explain the dotnet run vs debug difference. Try it with Hot Reload off and see if the spike goes.
If you’ve got a custom AddSwaggerGen sat on top of Umbraco 17’s Management API OpenAPI stuff, the ApiExplorer can end up scanning endpoints over and over - that ApiParameterDescription count makes me suspicious of exactly that.
Lots of App_Plugins or RCLs can make the static web asset manifest tree heavy too, so worth a look to see if anything’s rebuilding it. And anything else tucked inside if (env.IsDevelopment()), plus dev-only middleware like Browser Link.
Agreed, it could be OpenAPI recursive lookup that doesn’t stop for some reason. I had that (albeit client side) in the Swagger interface where it would simply run the browser out of memory.
I thought I’d caught them all, but I still had an UmbracoApiController hidden in the project which was causing the memory spiral. Change that out to a Controller and we’re laughing (reference doc here if anyone needs it).
All signs point to Swagger auto-gen, which would definitely back up the case of not running when in dotnet run. Still wouldn’t have thought it should cause a memory leak, I’ll see if I can screw it up in a vanilla and log the bug if so.